
Last Updated: 2026-05-21
Hearing Your Native Language Around You More Often Lately?
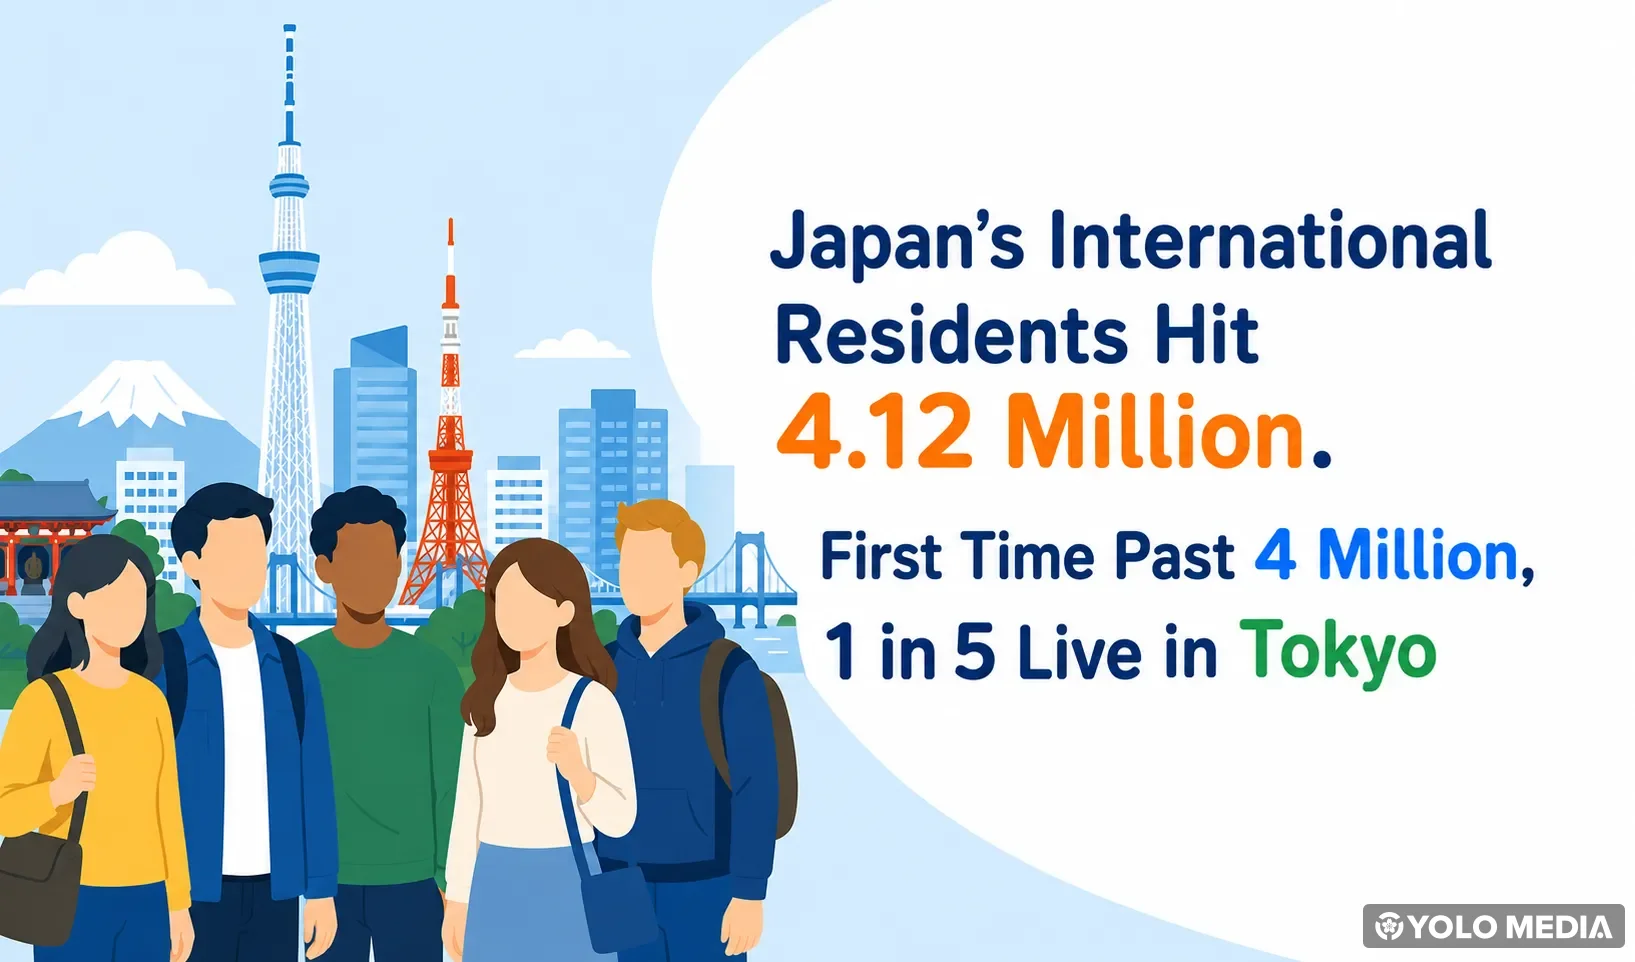
You may have noticed more multilingual signage at city offices, found ingredients from your home country at the grocery store, or heard your native language spoken on the street more frequently than before. That impression is clearly reflected in the latest statistics. According to Japan’s Immigration Services Agency, as of the end of 2025, 4,125,395 people with non-Japanese nationality were living in Japan. That’s the first time the number has exceeded 4 million, setting a new all-time record.
That’s up from 3,768,977 at the end of 2024, an increase of 356,418 people (+9.5%). Let’s break down the data by nationality, visa status, and prefecture to see what Japan looks like today.
(Source: Immigration Services Agency — International Residents at End of 2025)


TL;DR
- International residents in Japan hit 4,125,395 at the end of 2025. First time above 4 million
- Up 356,418 (+9.5%) from the previous year
- Top 3 nationalities: China (930,000), Vietnam (681,000), South Korea (407,000)
- Permanent residents (approx. 947,000) are the largest visa category. Specified Skilled Worker surged by +106,000 year-on-year
- About 800,000 are concentrated in Tokyo. Roughly 19.4% (1 in 5) of all international residents live there
Disclaimer: This article is based on official statistics for end-of-2025 (Reiwa 7) published by Japan’s Immigration Services Agency in 2026.
Breaking Down the 4.12 Million
| Rank | Nationality | Population (End of 2025) | Change from Previous Year |
|---|---|---|---|
| 1 | China | 930,428 | +approx. 60,000 |
| 2 | Vietnam | 681,100 | +approx. 50,000 |
| 3 | South Korea | 407,341 | Roughly unchanged |
| 4 | Philippines | 356,579 | +approx. 15,000 |
| 5 | Nepal | 300,992 | +approx. 70,000 |
China remains the largest group, but the standout growth comes from Vietnam and Nepal. Vietnam added about 50,000 in one year to reach the 681,000 range. Nepal surged past 300,000 for the first time, up from roughly 230,000 a year earlier. In terms of year-on-year increase, Nepal (+approximately 70,000) led all top 5 nationalities.
The driver in both cases is *work-oriented visas centered on Specified Skilled Worker (tokutei ginou)*. Once dominated by Chinese and Korean residents, Japan’s international community is shifting rapidly toward people from Southeast and South Asia who come to work and study.
Which Visa Statuses Are Most Common?
Here’s the breakdown using the latest end-of-2025 (Reiwa 7) data:
| Rank | Visa Status | Population (End of 2025) | Change from Previous Year | In Brief |
|---|---|---|---|---|
| 1 | Permanent Resident | 947,125 | +29,009 | No time limit on stay |
| 2 | Engineer / Specialist in Humanities / International Services | 475,790 | +57,084 | Work visa for IT, interpreting, marketing, etc. |
| 3 | Student | 464,784 | +62,650 | Language schools, vocational schools, universities |
| 4 | Technical Intern | 456,618 | +23 | Up to 5 years. Transitioning to ikusei shuurou from 2027 |
| 5 | Specified Skilled Worker | 390,296 | +105,830 | Work-ready visa for 14 sectors including caregiving, construction, agriculture |
(Source: Immigration Services Agency — International Residents at End of 2025)
What stands out from the table is that new entries for work and study purposes are surging. While permanent residents grew by only about 29,000, the four work and study related visa statuses (Engineer/Specialist, Student, Technical Intern, Specified Skilled Worker) added approximately 226,000 combined. That accounts for about 60% of the total 356,000 increase. People choosing to work or study in Japan have returned in force after COVID.
What’s also noteworthy is the shift in rankings. Technical Intern, long in second place, dropped to fourth, while Engineer / Specialist in Humanities / International Services climbed to second and Student to third. Specified Skilled Worker posted a massive year-on-year jump of about 106,000, entering the top 5 for the first time. With Technical Intern flatlining (only +23) and Specified Skilled Worker exploding, the data clearly shows the shift toward ready-to-work talent ahead of the 2027 transition to the ikusei shuurou (Employment for Skill Development) program.
Where Are They Living?
Top 5 prefectures by population (end of 2025):
| Rank | Prefecture | Population (End of 2025) | Change from Previous Year |
|---|---|---|---|
| 1 | Tokyo | 801,438 | +62,492 (+8.5%) |
| 2 | Osaka | 375,319 | +41,755 |
| 3 | Aichi | 357,800 | +26,067 |
| 4 | Kanagawa | 317,353 | +24,903 |
| 5 | Saitama | 290,937 | +28,555 |
Tokyo alone accounts for about 19.4% of the national total. Out of 4.12 million people, roughly 1 in 5 lives in Tokyo. Combined, the top 5 prefectures hold about 2.14 million people, or about 52% of the national total. More than half of all international residents in Japan are concentrated in these 5 prefectures.
Two Major Hubs Beyond Tokyo: Kansai and Tokai
The data shows that Japan’s international residents form a three-pole structure: greater Tokyo, Kansai, and Tokai, rather than concentrating in Tokyo alone. Osaka, the second-largest hub, centers on tourism, food service, and retail in the commercial and service sectors. Aichi, the third, draws international talent through automotive-related manufacturing. In fact, Aichi ranks first nationally for the number of Specified Skilled Worker visa holders, showing how the automotive supply chain has become a major employer of international workers.
(Source: Immigration Services Agency — International Residents Statistics)
Absolute Numbers vs. Growth Rates Tell Different Stories
In absolute terms, Tokyo’s +62,000 dominates the growth. It’s followed by Osaka +42,000, Saitama +29,000, Aichi +26,000, and Kanagawa +25,000. But when ranked by year-on-year growth rate, the order shifts considerably.
| Prefecture | Year-on-Year Growth Rate |
|---|---|
| Osaka | +12.5% |
| Saitama | +10.9% |
| Tokyo | +8.5% |
| Kanagawa | +8.5% |
| Aichi | +7.9% |
Osaka leads with +12.5%, growing faster than Tokyo. Saitama, with its double-digit growth at +10.9%, follows close behind. People new to Japan appear to be choosing Saitama for its lower housing costs near the capital, and Osaka as the hub of the Kansai region.
Tokyo’s concentration certainly continues. But the new trend from this prefectural data is that growth speed in Kansai and the outer Tokyo metropolitan area is starting to outpace Tokyo itself.
What These Numbers Mean
The 4.12 million figure represents about 3.3% of Japan’s total population (approximately 124 million), or roughly 1 in every 30 people. Let’s look at this number from several angles.
1.8x Growth Over 10 Years
Looking at the long-term data from the Immigration Services Agency, the count at the end of 2015 was about 2.23 million. The increase to 4,125,395 at end of 2025 represents roughly a 1.85x expansion. What’s notable is the pace: after a temporary dip during COVID, 2023 to 2025 saw annual increases of 300,000 to 350,000, a sharply rising curve.
Japan’s Overall Population Is Shrinking
During the same period, Japan’s total population (including Japanese nationals) has been declining. According to the latest population estimates from Japan’s Statistics Bureau (as of December 1, 2025, published in May 2026), the Japanese population fell by approximately 914,000 in one year (-0.76%). Meanwhile, the non-Japanese population grew by approximately 336,000 (+9.35%) in the same period. Both indicators show the largest movements in recent history.
The Japanese population’s decline is about 2.7 times the size of the non-Japanese population’s growth. Even though the growth in international residents partially cushions the Japanese population’s sharp drop, the overall trend is that Japan’s total population is shrinking by 500,000 to 600,000 people each year.
(Source: Statistics Bureau of Japan — Population Estimates (December 1, 2025))
The Center of Gravity Has Shifted Across All of Asia
A decade ago, China and South Korea alone accounted for about half of all international residents. Today, the two combined make up only about 32%. Instead, Vietnam (681,000), Philippines (356,000), Nepal (301,000), Indonesia, and Myanmar have rapidly increased their presence. With the Technical Intern and Specified Skilled Worker programs as major drivers, the “face” of Japan’s international community has been substantially redrawn from primarily East Asian to pan-Asian in just 10 years.
As the national composition diversifies, it becomes easier to find a city office that handles your language, or to encounter communities of people from your home country.
These Changes Are Expanding Daily-Life Options
The changes in numbers are showing up in many everyday situations. More city offices offer information in easy Japanese (yasashii nihongo) or close-to-native-language guidance. Some municipalities now hold multilingual disaster preparedness drills. Schools are increasingly building support systems for children whose native language is not Japanese, making it easier for families to settle in Japan.
It’s also becoming easier to find communities of people from your home country, and grocery stores selling ingredients from various countries are spreading even to regional cities. Behind the 4.12 million figure, the environment that supports our daily lives has changed dramatically over the past 10 years.
FAQ
Q. How can I find out the number of international residents in my city or town?
A. You can access free statistics through Japan’s official statistics portal e-Stat, which publishes international resident counts broken down by municipality and nationality. Look for “Statistics on International Residents” → “International Residents by Municipality and Nationality.” This is useful when considering a move or looking for community ties from your home country.
Q. Why are permanent residents the largest group?
A. Permanent residency has no expiration date, so the number naturally accumulates each year. Other visa statuses have fixed terms with regular turnover, but permanent residents remain. If you’re weighing the choice between permanent residency and naturalization (Japanese citizenship), our Permanent Residency vs. Naturalization Guide is also worth a read.
Q. What’s the real reason behind the 356,000 increase in one year?
A. The largest factors are the surge in Specified Skilled Worker (+106,000 year-on-year, +37%) and the growth in student and professional visas (combined approximately +120,000). Three structural changes form the backdrop:
- Deepening domestic labor shortages: Japan’s population fell by about 914,000 in one year (Statistics Bureau). Caregiving, construction, and agriculture face chronic worker shortages.
- Expansion of Specified Skilled Worker: The government has expanded coverage to 14 sectors and is preparing for the 2027 transition to ikusei shuurou (Employment for Skill Development). Infrastructure to receive ready-to-work talent is being put in place.
- Post-COVID normalization: New entries by students and workers have fully resumed, and family reunification continues to grow steadily.
A July 2025 “Economics Panel” survey conducted by the Japan Center for Economic Research and Nikkei polled about 50 economists. 76% of respondents said the increase in international residents contributes to improving Japanese living standards (85% on a weighted basis). 66% (77% weighted) also said it contributes to improving fiscal balance. Both labor shortage and fiscal sustainability concerns have driven strong endorsement of expanding international resident intake among economists (Japan Center for Economic Research — Economics Panel 7th Survey).
For more on Japan’s workforce reception system, see our article on the Specified Skilled Worker cap rising to 1.23 million.
Key Takeaways
- ✅ International residents reached 4,125,395 at end of 2025. First time past 4 million, up 9.5%
- ✅ Nepal crossed 300,000 for the first time. Migration from Asian countries is accelerating
- ✅ Permanent residents lead at about 947,000. Specified Skilled Worker surged by +106,000 year-on-year, entering top 5 for the first time
- ✅ Tokyo holds over 800,000, about 19.4% of the national total. Top 5 prefectures account for about 52%, showing a concentrated structure
- ✅ In growth rates, Osaka (+12.5%) and Saitama (+10.9%) outpace Tokyo, with acceleration in Kansai and outer Tokyo metropolitan areas
The 4.12 million figure is more than just another record. Japan’s population dropped by about 914,000 in one year, while international residents grew by about 356,000. Japan’s structural social transformation is now visibly reflected in the numbers. The center of gravity for nationalities has shifted from China and South Korea to Southeast and South Asia, and the gateway for entry has shifted from Technical Intern to Specified Skilled Worker. The hubs of settlement are no longer limited to Tokyo, but expanding to Kansai, Tokai, and the outer Tokyo metropolitan area.
These changes are reshaping the language services, government responses, and community structures of the cities we live in. While it’s becoming easier to meet people from your home country and to find support in your native language, society as a whole is also being asked to step up its multilingual and multicultural capacity. Understanding the breakdown of 4.12 million is the first step toward broadening your own life options going forward in Japan.


![Venus, the Evening Star, Is Shining in the Western Sky: How to Spot It After Sunset [June 2026]](https://media.yolo-japan.com/wp-content/uploads/2026/06/moon-jupiter-venus-june-2026-en-new-768x403.webp)